Overview
Host Network Analytics helps you understand how your Kubernetes pods communicate over the network, without changing your application code or kernel modules.
With this feature, you can:
- See how pods, nodes, and services talk to each other
- Analyze network traffic (packets, bytes, latency)
- Track ingress and egress traffic
- Detect packet drops and TCP retransmissions
- Visualize the network topology between services
- Quickly identify network performance or connectivity issues
How Host Network Analytics enhances Kubernetes 2.0
| Existing Kubernetes 2.0 | With Host Network Analytics |
|---|---|
| Monitors clusters, nodes, pods, and workloads | Tracks individual pod’s network usage and performance |
| Collects metrics, logs, traces, and events | Provides data on throughput, latency, drops, and retransmissions |
| Basic visibility | Deep, kernel-level network insights (e.g., packet drops, retransmits) |
How Host Network Analytics works
- A Host Network worker (eworer) pod is deployed as a DaemonSet.
- One worker pod runs on each node in the cluster.
- Each worker:
- Uses Host Network Analytics to collect kernel-level network data.
- Enriches every packet information with:
- Pod name, namespace, node
- Application resource (Deployment, DaemonSet, ReplicaSet, StatefulSet)
- FQDN
- Traffic type (internal / external)
- Aggregates based on pods and sends enriched data to OpsRamp cloud.
Proxy support
If your cluster uses a proxy:
- The agent automatically detects configured proxy settings.
- All Host Network (eBPF) telemetry is sent via the proxy when present.
For proxy configuration details, see Kubernetes 2.0 Agent Installation guide.
Prerequisites
Before enabling Host Network Analytics, ensure the following:
1. Supported container runtimes
Your Kubernetes cluster must use one of these container runtimes:
- CRI-O
- Containerd
- Docker
Refer to the Compatibility Matrix for exact version support.
2. Custom runtime socket path
If your environment uses a custom container runtime socket (path different from default), you must pass it during Helm install or upgrade, for example:
Docker
--set containerSockFile.docker=/var/run/docker.sock--set containerSockFile.cri-o=/var/run/crio/crio.sock--set containerSockFile.containerd=/var/run/containerd/containerd.sock3. Enable Host Network Analytics during agent installation
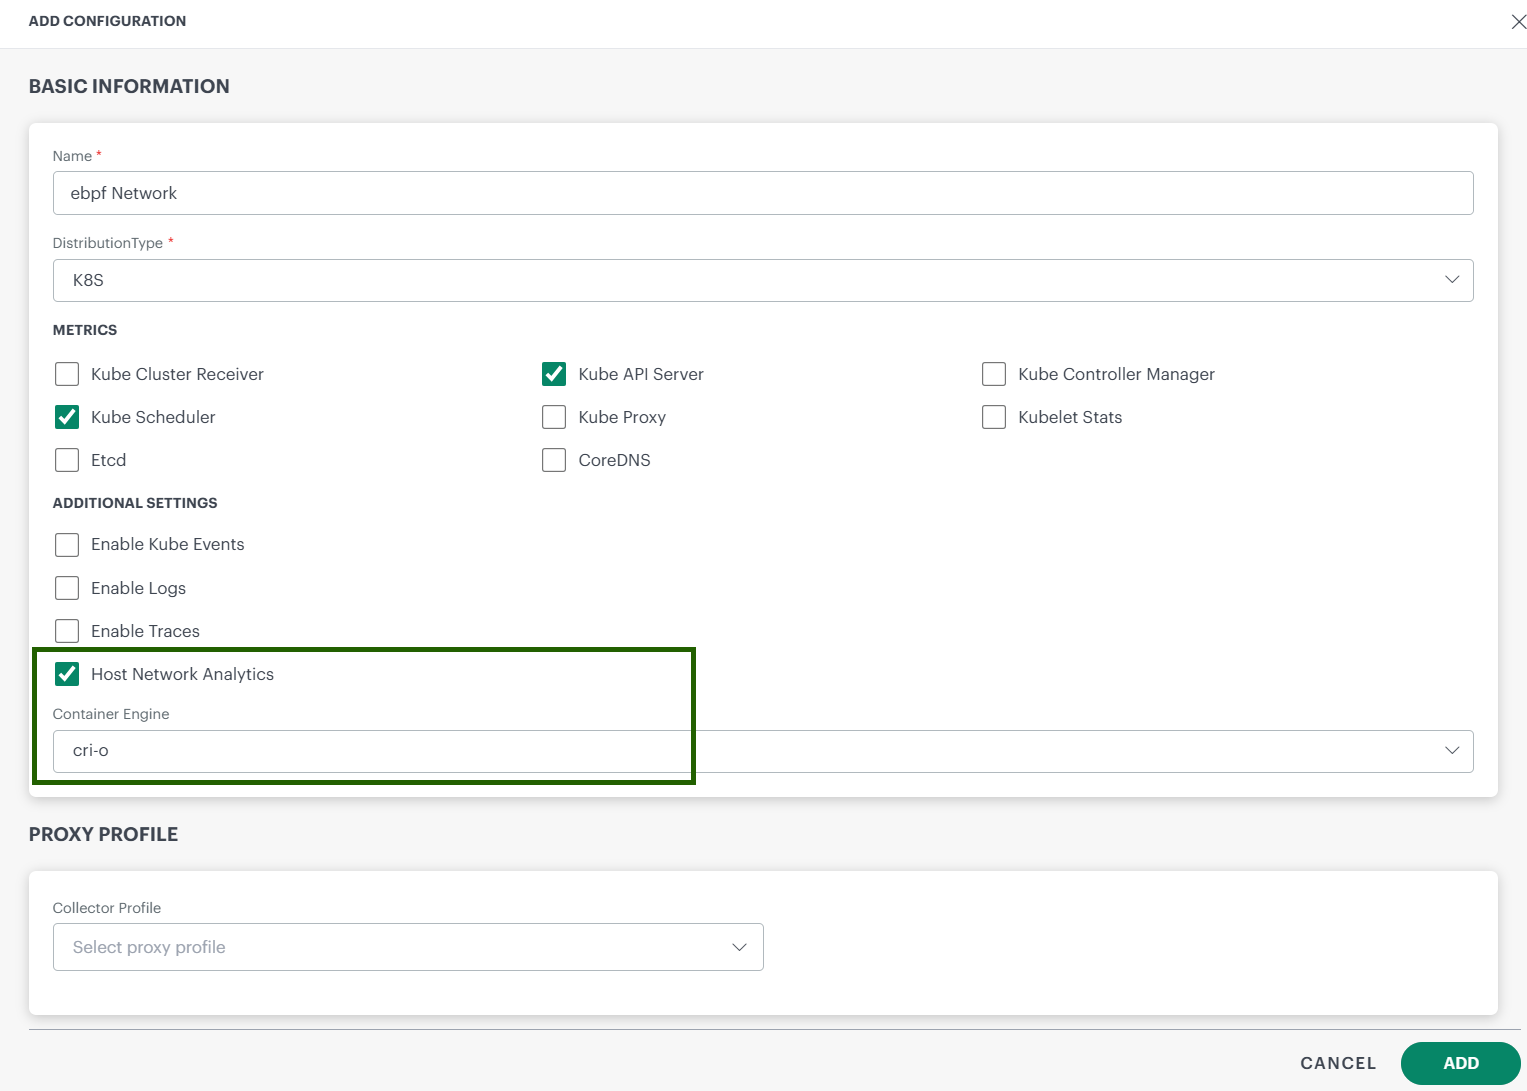
- During installation of the Kubernetes 2.0 agent, ensure that the Host Network Analytics option is enabled and the appropriate container engine is selected.
- For more details, refer to the Kubernetes 2.0 Agent Installation guide.
Limitations
- Only CRI-O, Containerd, and Docker runtimes are supported.
- Unsupported runtimes may cause Host Network worker (eworker) pod failures or no data collection.
- Cgroup v2 is required on the node OS.
- Host Network Analytics is supported only with Kubernetes 2.0 agent (not Kubernetes 1.x).
- If the
NetworkObservabilityCR is misconfigured (e.g., wrong namespace or selectors), some pods/nodes may not be monitored.
The above limitations are important for troubleshooting: If you do not see data, first check:
- Runtime type and version
- Cgroup version (must be v2)
- eworker pod status and logs
- NetworkObservability CR configuration
Permissions
Following permissions required to install the Linux OS Integration:
| Category | Permission Type | Permission Value |
|---|---|---|
| Network | Host Network Analytics | View / Manage |
| Account Administration | Custom Attributes | View |
Info
Host Network Analytics_Manage is required only for modifying data-retention policies.Refer to the Permission Sets document for more details on obtaining the necessary permissions.
Compatibility Matrix
Use this table to verify that your environment is supported.
| Component | Supported Versions |
|---|---|
| Operating Systems | Fedora 41+, Ubuntu 22.04+, RHEL 9.0 + |
| Container Runtime | CRI-O (v1.29, v1.30.0, v1.32.3), ContainerD 1.7.25, Docker |
| Cgroups | Cgroupv2 |
| Kubernetes | Kubernetes and K3s |
Note
If you run outside these versions, Host Network worker pods may not start correctly or may not collect data.Steps to Configure
By default, Host Network Analytics monitors all pods and all nodes in the cluster. If you want to:
Includeorexcludepods from specific namespaces or nodes- Limit monitoring to selected workloads
you can do so by configuring the
NetworkObservabilityCustom Resource (CR).
Step 1: Check whether the CR already exists
kubectl get netobs network-observability-config -n <opsramp-agent-namespace>Step 2: If the CR exists, edit it using the sample configuration below
kubectl edit netobs network-observability-config -n <opsramp-agent-namespace>Step 3: If the CR does not exist, create it using a YAML file and apply the configuration
kubectl apply -f netobs-sample.yamlSample Configurations
1. Include (whitelist) all namespaces
apiVersion: network.agent.opsramp.com/v1
kind: NetworkObservability
metadata:
  name: network-observability-config
  namespace: <opsramp-agent-namespace>
spec:
  targetCgroupSelectors:
    - action: include
      namespaces:
- "*"- Meaning: Monitor pods in all namespaces ("*").
2. Include (whitelist) all nodes
apiVersion: network.agent.opsramp.com/v1
kind: NetworkObservability
metadata:
  name: network-observability-config
  namespace: <opsramp-agent-namespace>
spec:
  targetCgroupSelectors:
    - action: include
      nodeNames:
- "*"- Meaning: Monitor pods on all nodes ("*").
3. Include only selected namespaces
apiVersion: network.agent.opsramp.com/v1
kind: NetworkObservability
metadata:
  name: network-observability-config
  namespace: <opsramp-agent-namespace>
spec:
  targetCgroupSelectors:
    - action: include
      namespaces:
        - "default"
- "opsramp-agent"- Meaning: Monitor pods only in the default and
opsramp-agentnamespaces.
4. Exclude selected namespaces (and include the rest)
apiVersion: network.agent.opsramp.com/v1
kind: NetworkObservability
metadata:
  name: network-observability-config
  namespace: <opsramp-agent-namespace>
spec:
  targetCgroupSelectors:
    - action: exclude
      namespaces:
        - "default"
    - action: include
      namespaces:
- "*"- Meaning: Exclude pods in the default namespace, and monitor pods in all other namespaces.
Key Field Definitions
| Field | Description |
|---|---|
| targetCgroupSelectors | Ordered list of selection rules that determines which pods are monitored. |
| action | include or exclude matching pods. |
| namespaces | Namespace list to match (use "*" to match all). |
| nodeNames | Node name list to match (use "*" to include all nodes). |
Note
- The CR must be named
network-observability-config. Custom names are not supported. - You can define multiple selectors under
targetCgroupSelectorsto implement different include/exclude rules. - The combination of
ordered selectors + include/excludeactions provides fine-grained control of what gets monitored
View Host Network Dashboards in OpsRamp Portal
The Host Network Analytics dashboard provides visibility into network traffic, packet flow, latency, and communication patterns between pods and services in a Kubernetes cluster. It helps users understand who is communicating with whom, how much data is transferred, and whether there are network issues such as packet drops or latency.
1. Infrastructure → Host Network Analytics
- Go to Infrastructure → Host Network Analytics.
- Use the filters to select:
- Cluster
- Namespace
- Pod
- View detailed pod-level network metrics and charts.
Host Network Analytics – Fields & UI Elements
| Category | Field / UI Element | Description |
|---|---|---|
| Context Selection | Cluster | Displays the Kubernetes cluster from which host network data is collected. Users can switch clusters to analyze different environments. |
| Namespace | Filters network analysis to workloads running within the selected namespace. | |
| Pod | Limits the dashboard view to a specific pod for focused network analysis. | |
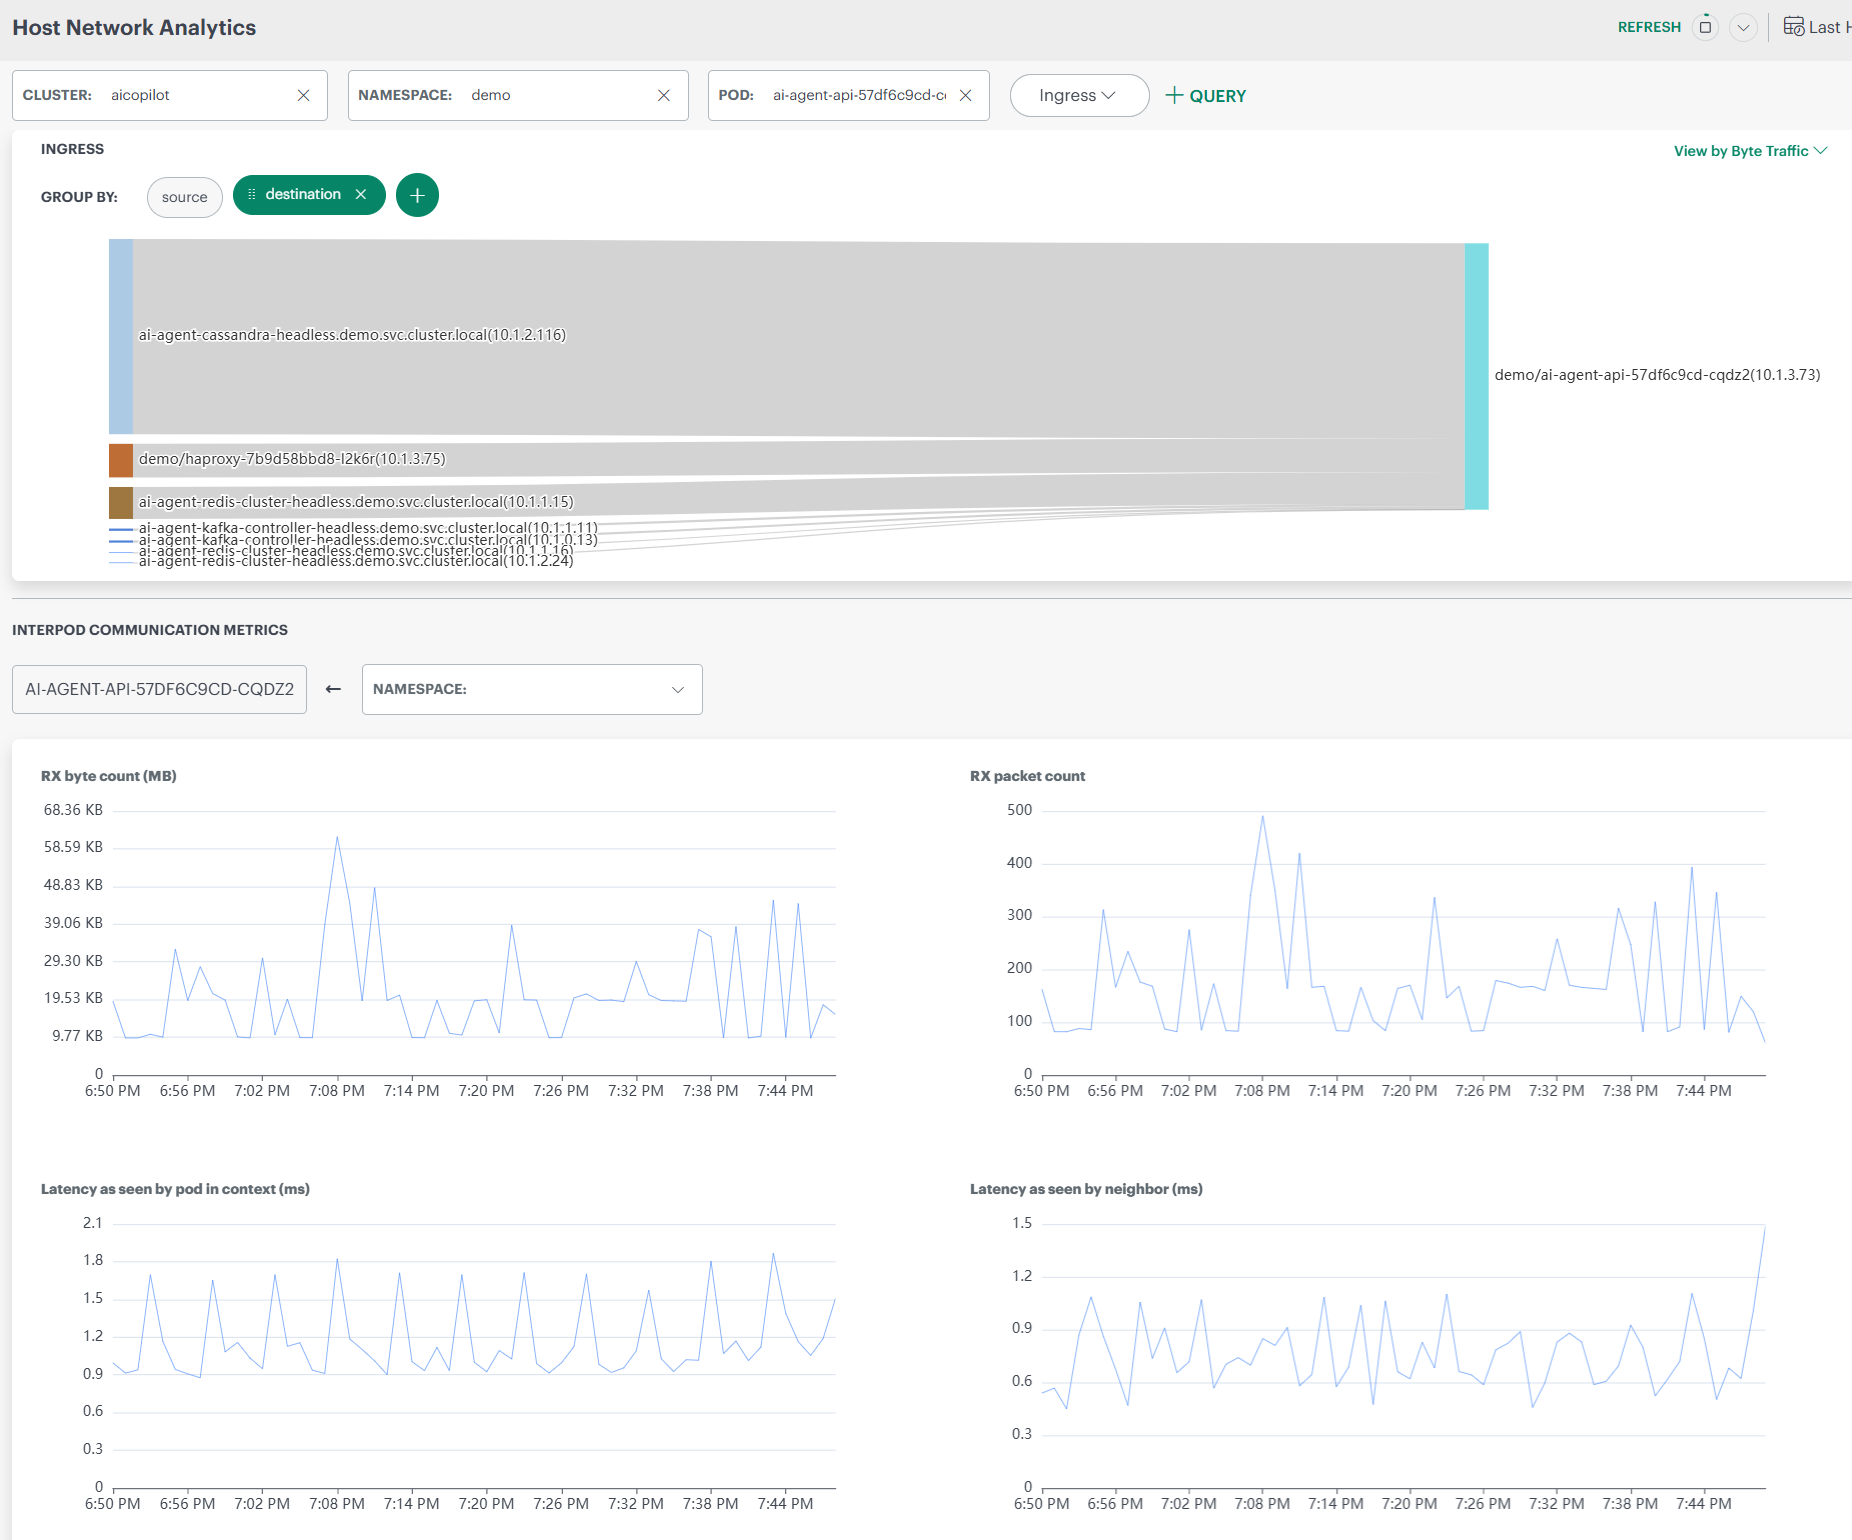
| Traffic Direction | Ingress | Indicates incoming network traffic to the selected pod or namespace. |
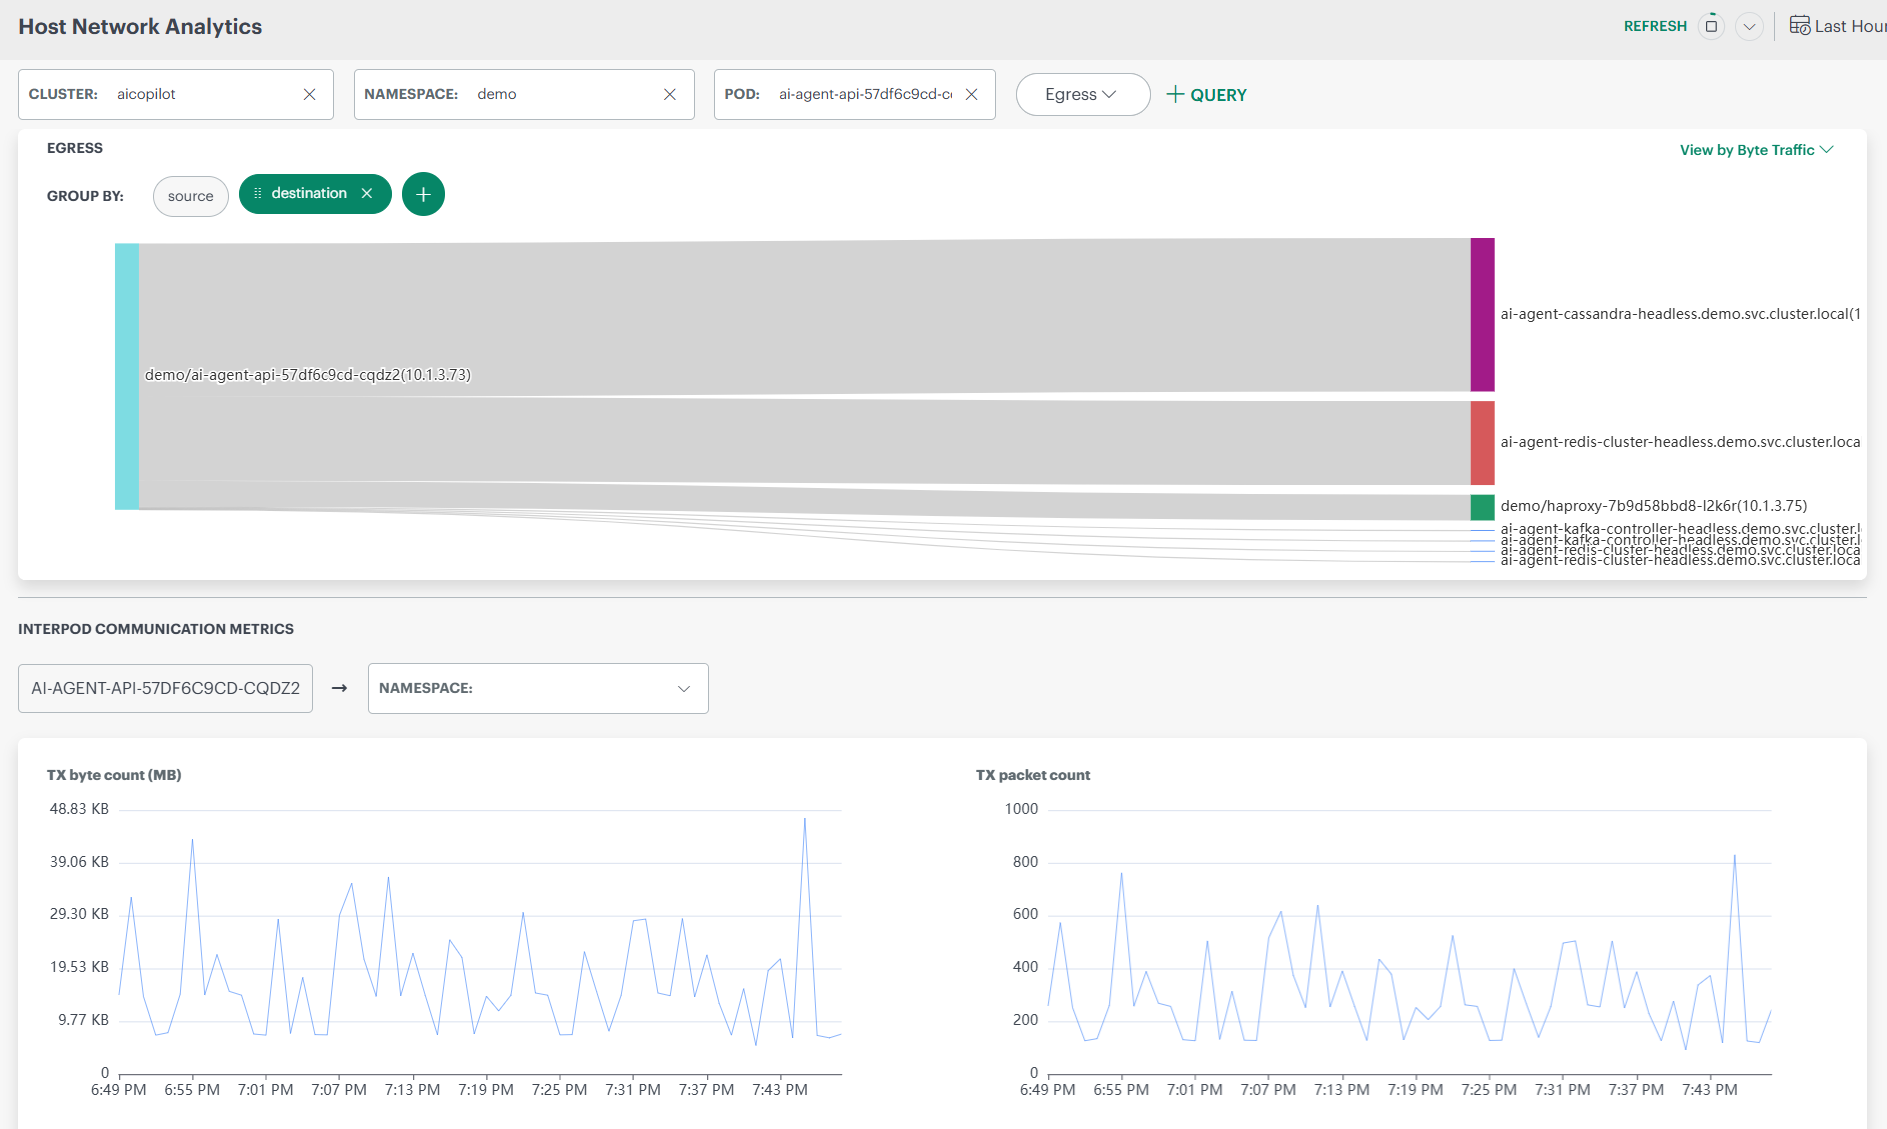
| Egress | Indicates outgoing network traffic from the selected pod or namespace. | |
| Grouping Controls | Group By – Source | Groups network traffic based on the originating pod or service. |
| Group By – Destination | Groups network traffic based on the receiving pod or service. | |
| Source + Destination | Shows communication paths between sources and destinations together. | |
| Time Controls | Time Range | Defines the time window (for example, Last Hour) for which network data is displayed. |
| Refresh | Reloads the dashboard to display the most recent network data. | |
| Traffic View Options | View by Byte Traffic | Displays network flow based on data volume (bytes transferred). |
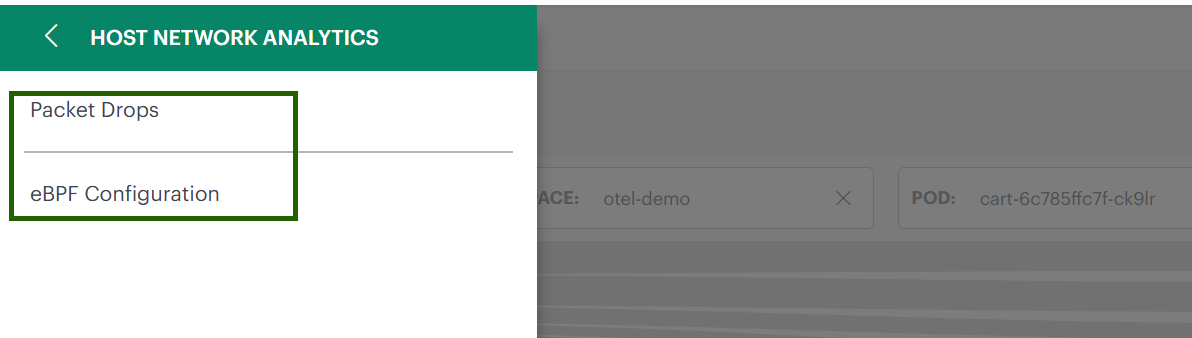
In the Host Network Analytics menu, you will see two options that help you manage and analyze network data:
- Packet Drops
- eBPF Configuration
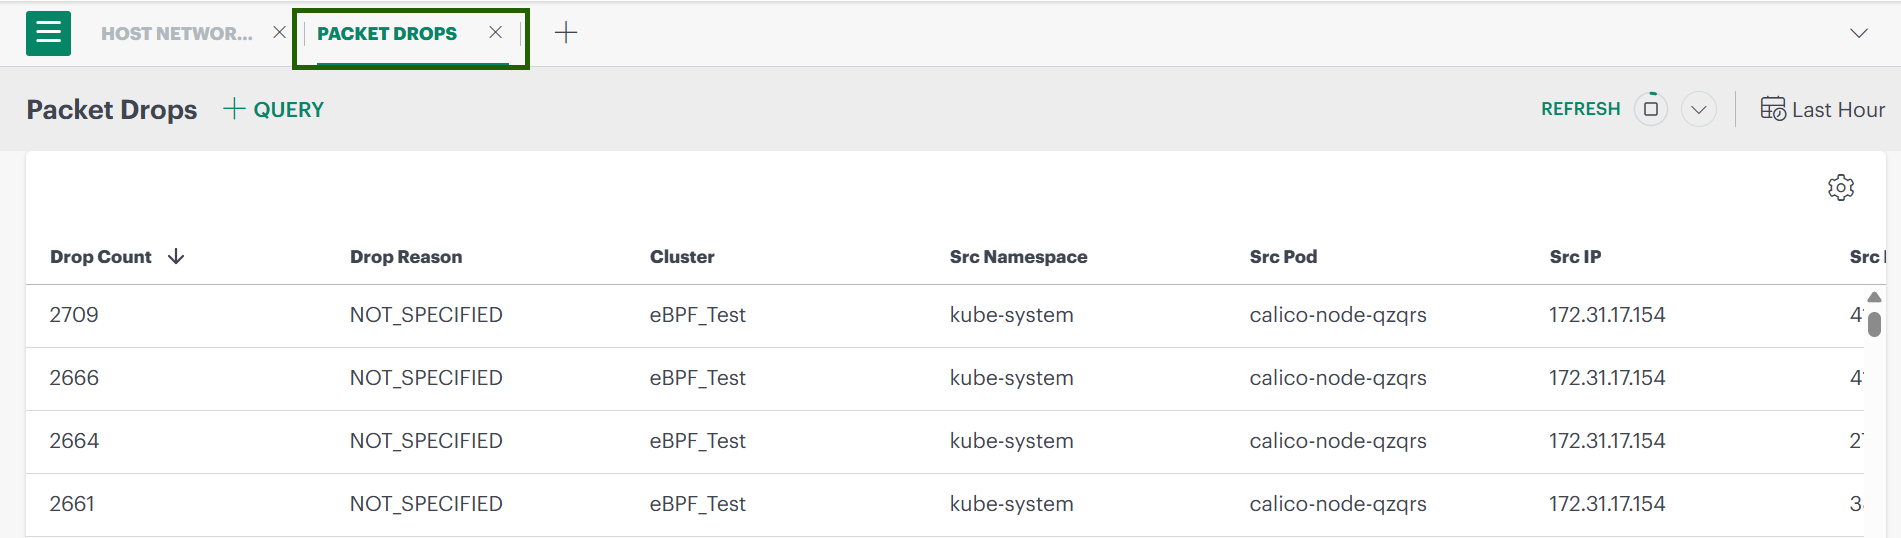
Packet Drops
The Packet Drops option helps you identify network packets that failed to reach their destination due to network, policy, or configuration issues.
Steps to View Packet Drops
- Select Packet Drops from the menu.
- The Packet Drops dashboard opens and displays the following details:
- Drop Count – Number of packets dropped
- Drop Reason – Cause of the packet drop
- Cluster – Cluster where the drop occurred
- Source Namespace
- Source Pod / IP / Port
- Destination Pod / IP / Port
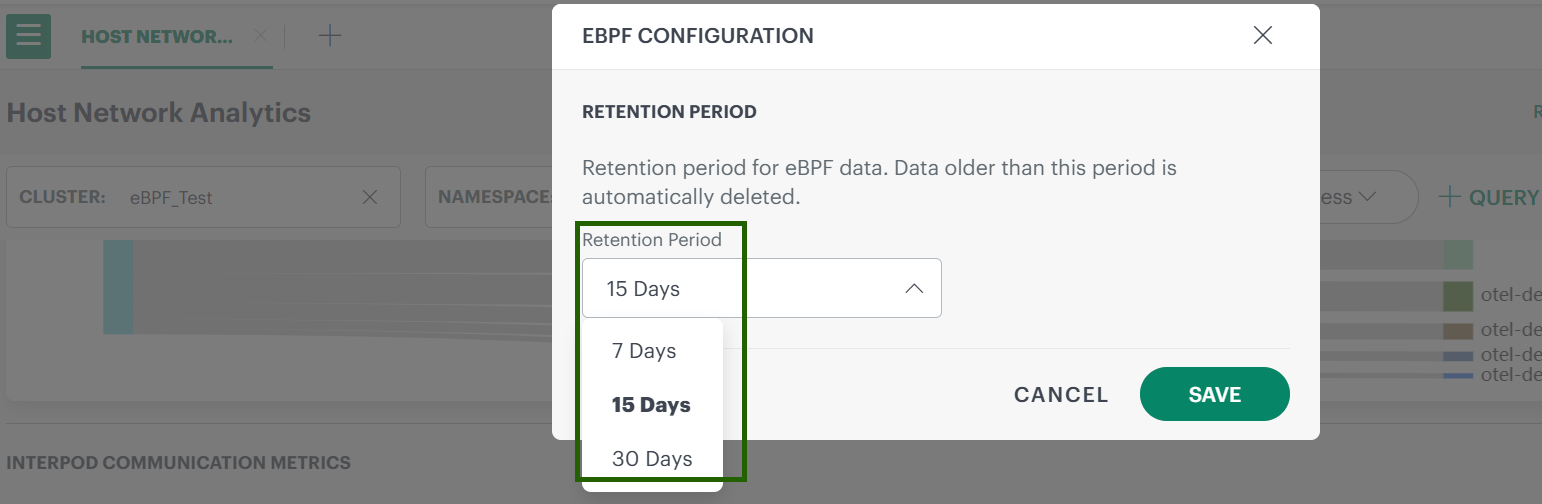
eBPF Configuration
Use eBPF Configuration to control how long host network analytics data is retained. You can adjust the retention period based on your monitoring and compliance needs. Data older than the configured period is automatically deleted.
Steps to Configure Retention Period
- Select eBPF Configuration from the menu.
- On the eBPF Configuration page, choose the required Retention Period.
- Click Save to apply the changes.
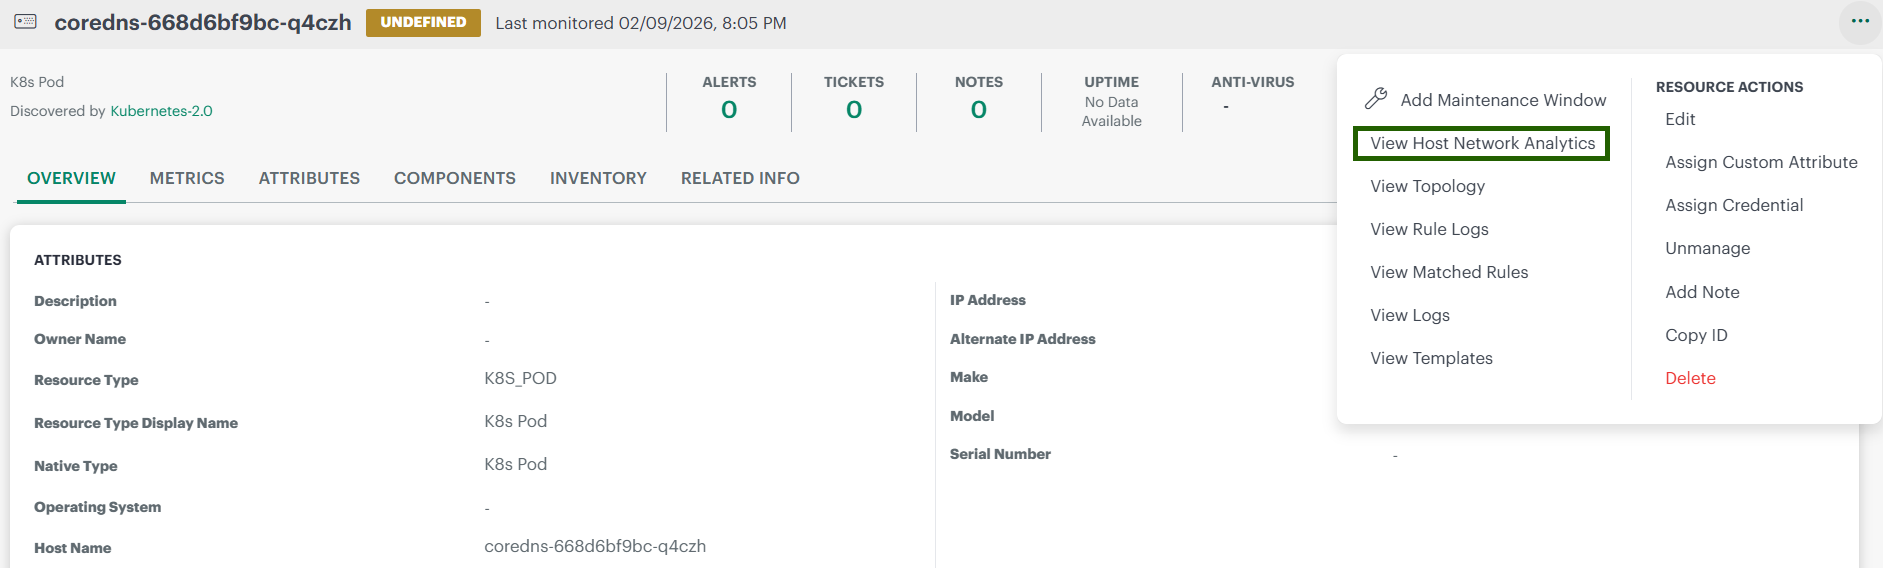
2. Infrastructure → Search (Pod View)
- Navigate to Infrastructure → Search.
- Select your Kubernetes 2.0 cluster → Pods.
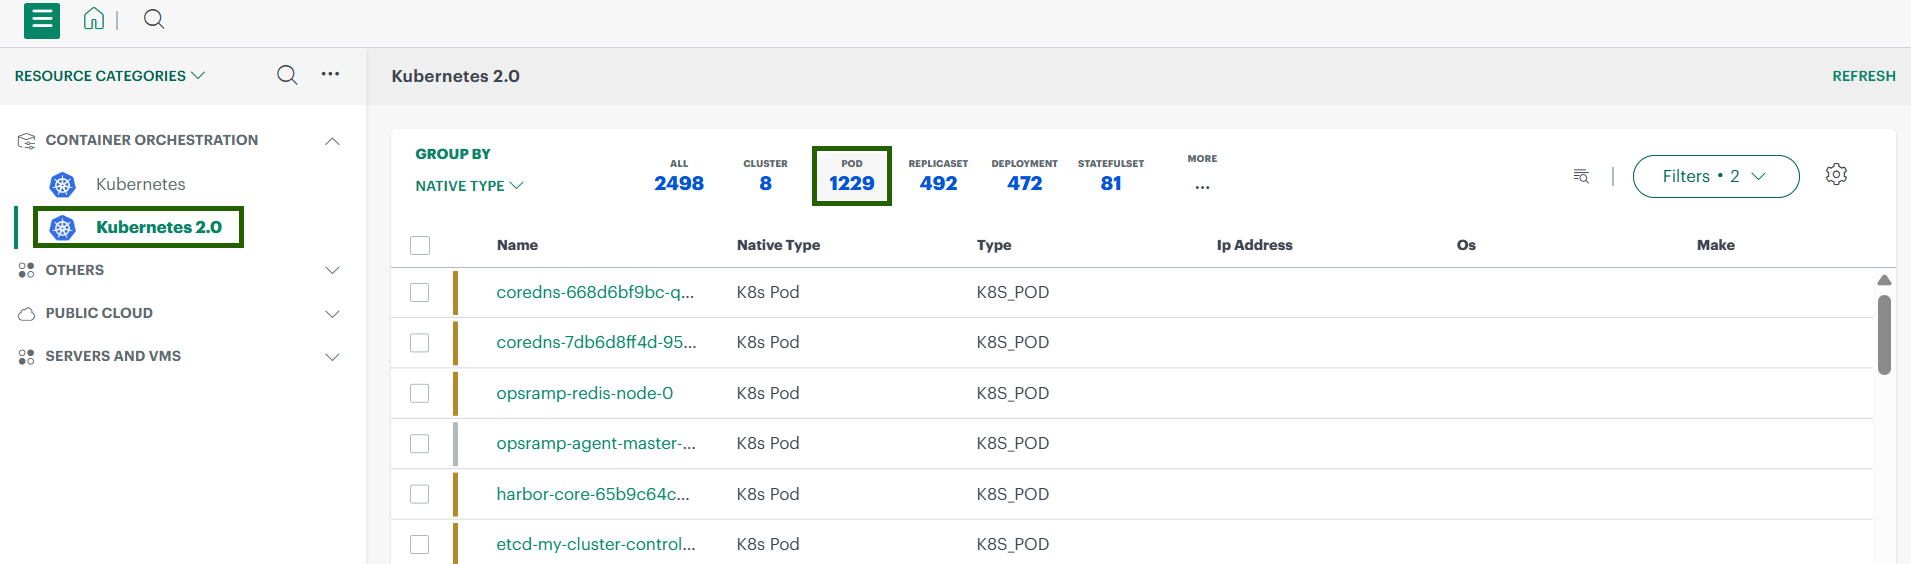
- Open a pod’s resource tile.
- From the three-dot menu, click View Host Network Analytics to view the dashboard.
3. Infrastructure → Traces
The Traces view combines application traces with network metrics from Host Network Analysis.
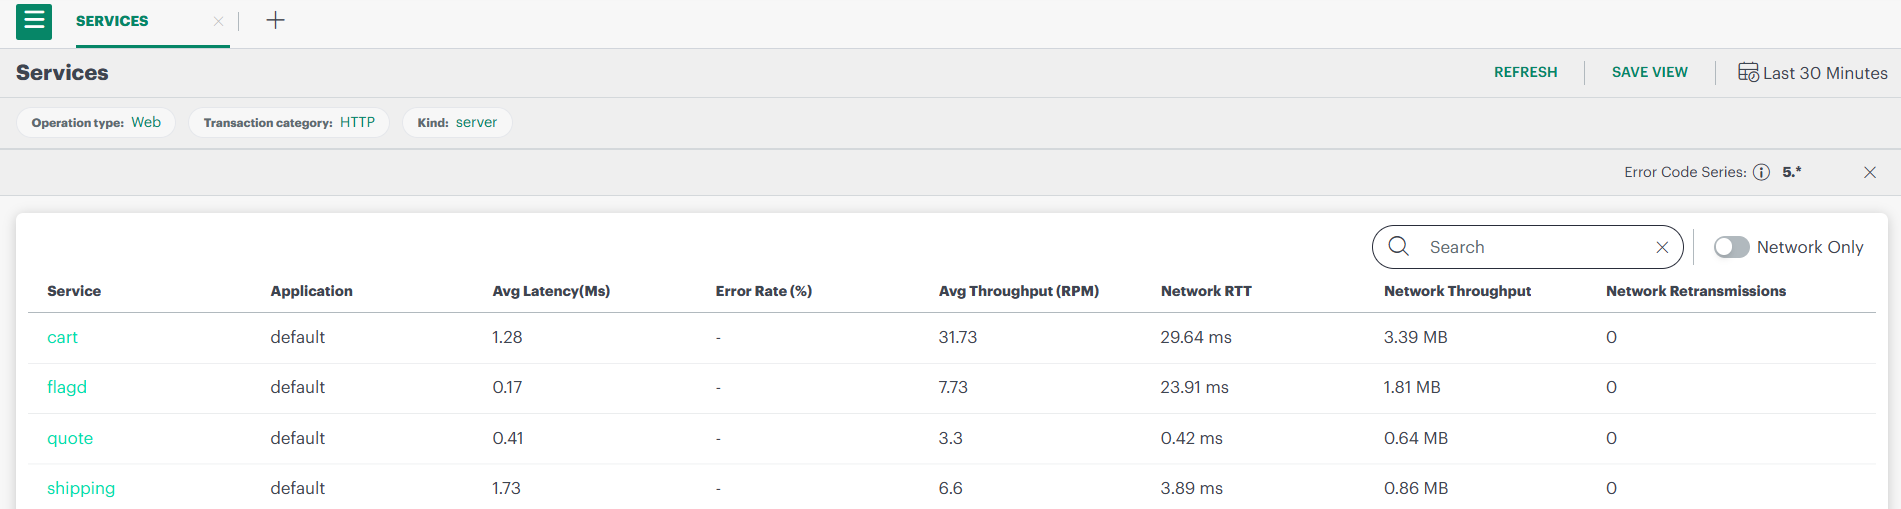
3.1 View All Trace Services
- Go to Infrastructure → Traces.
- The list shows all trace services.
- Each service includes extra network metrics:
- Network Latency
- Network Throughput
- Network Retransmissions
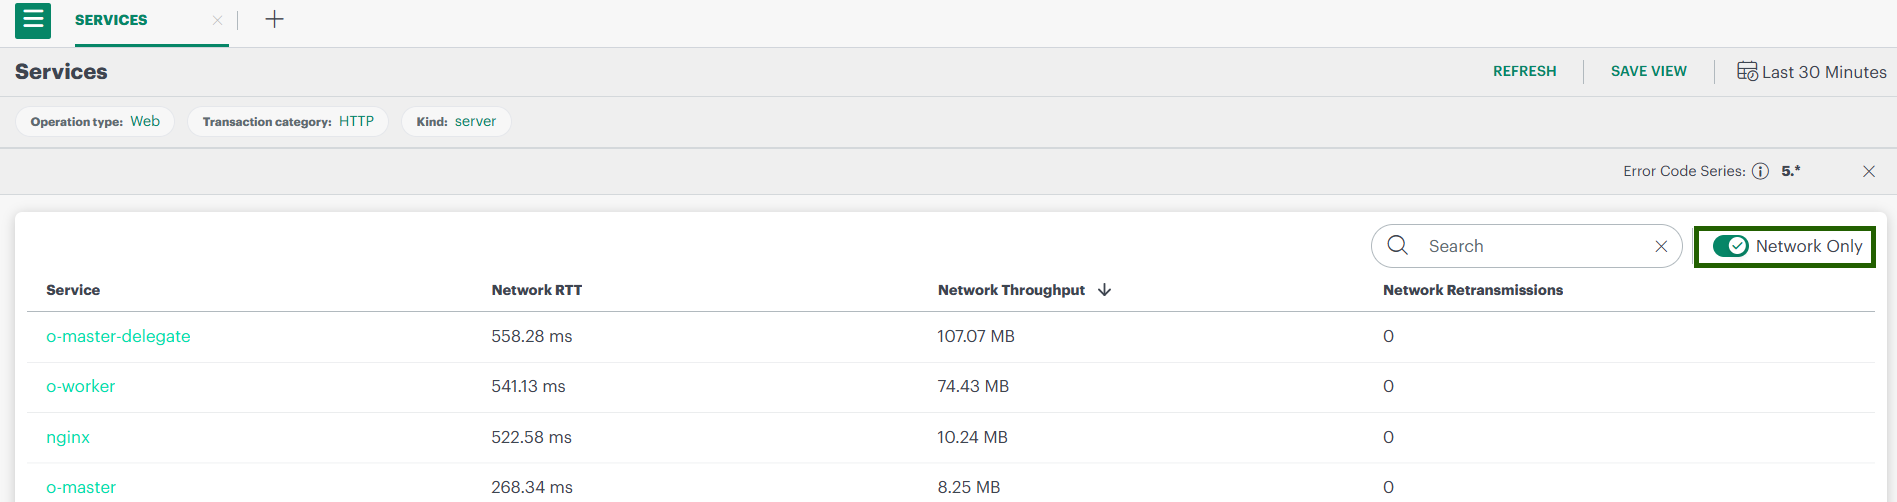
3.2 View Network-Only Services
- In the Traces view, enable the Network Only toggle.
- The list now shows network-level services enriched by Host Network Analytics.
- Click any service to open detailed analytics.
You will see sections like:
- Service Metrics
- Network RTT
- Network Throughput
- Network Retransmissions
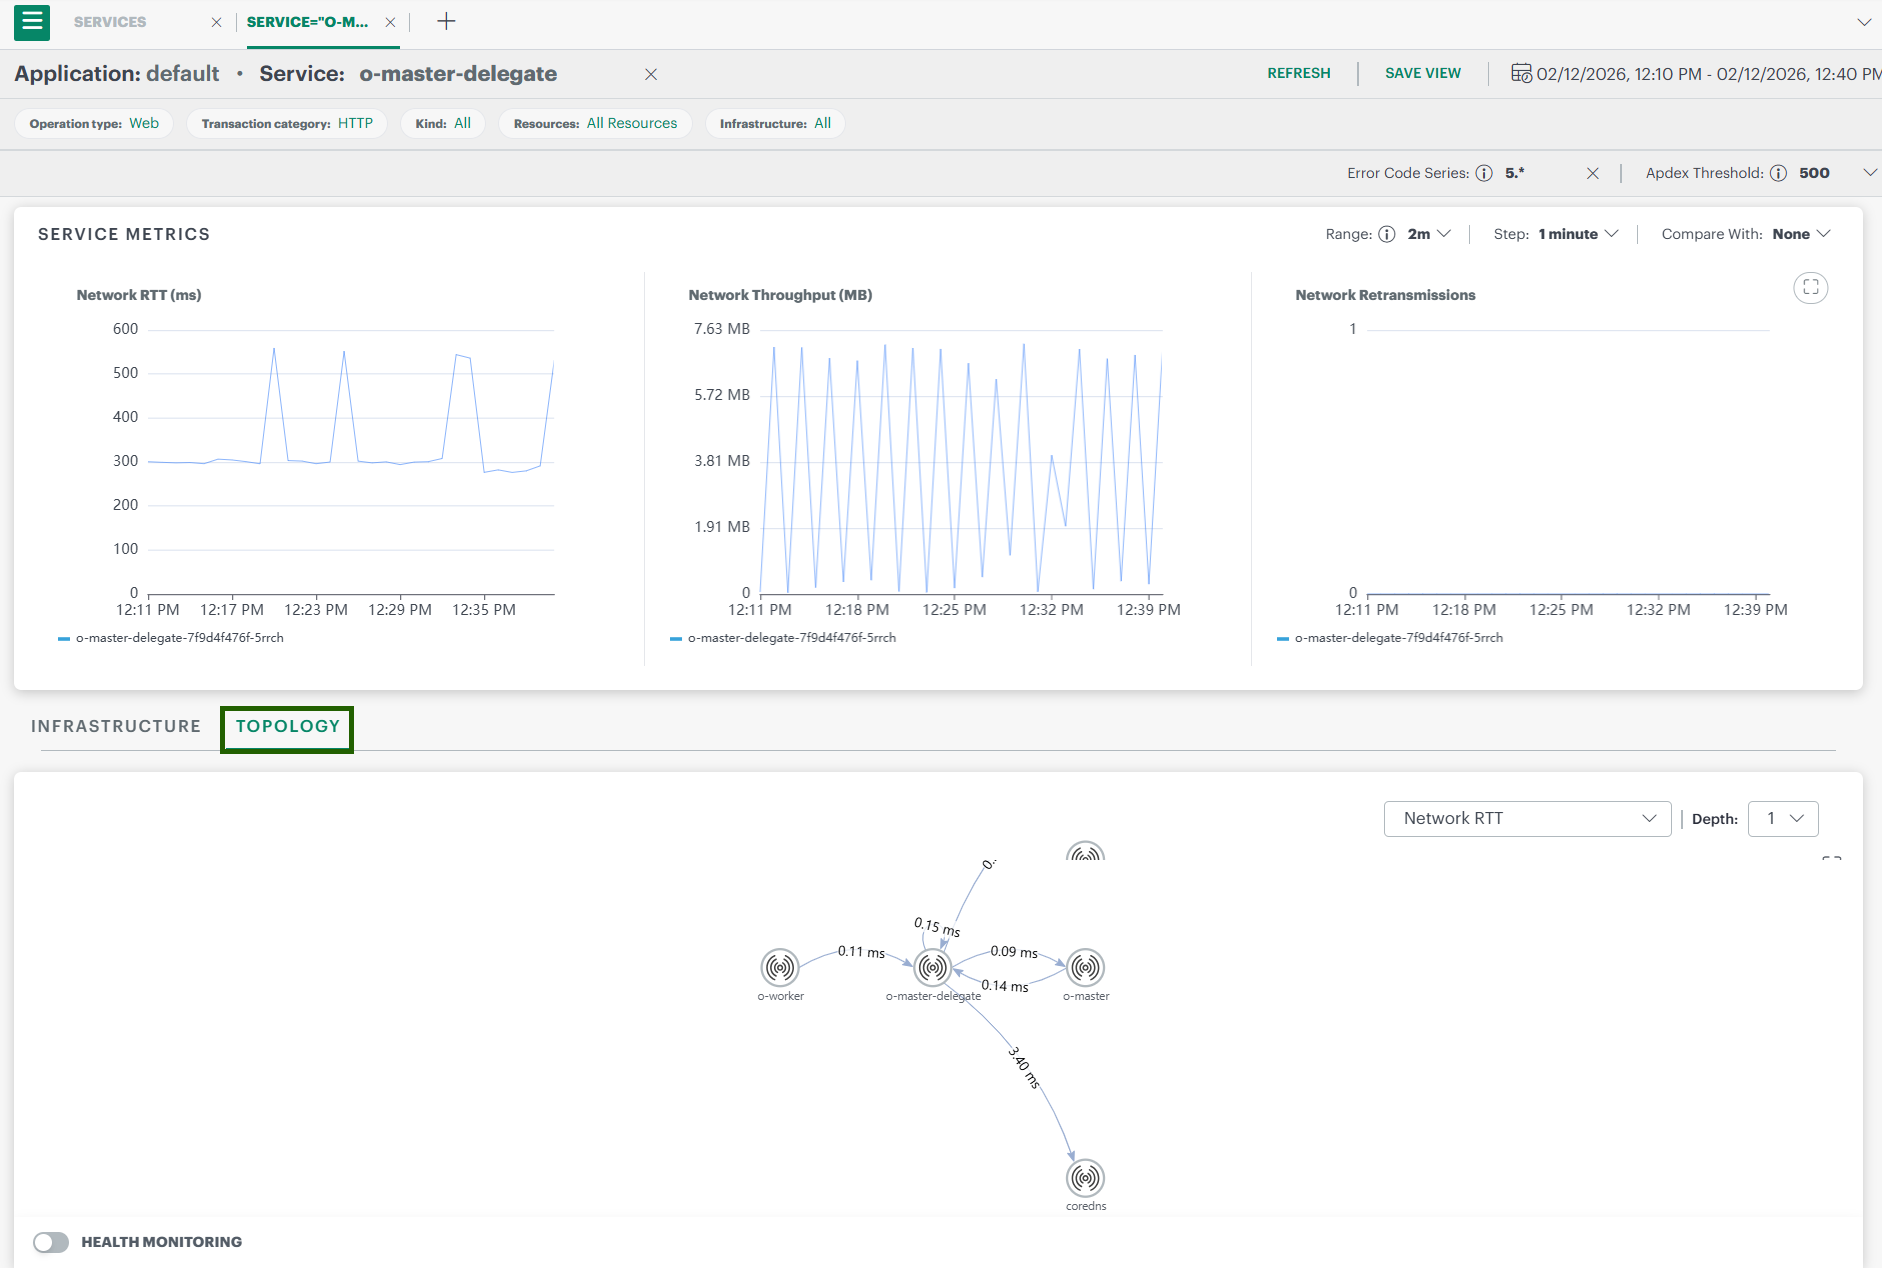
3.3 Network Topology View
When a service is selected, you can open the Network Topology graph.
This graph helps you:
- Understand how services communicate
- See traffic paths and dependencies
- Quickly locate potential bottlenecks or failure points
- Network-level services are now enriched using host-level service data, allowing visibility into non-instrumented services.
Network Topology Fields
| Field | Description |
|---|---|
| Service / Pod Name | Name of the workload communicating within the topology. |
| Namespace | Kubernetes namespace where the pod or service runs. |
| Node | Kubernetes node on which the pod is scheduled. |
| Traffic Direction | Shows whether traffic is ingress (incoming) or egress (outgoing). |
| Volume / Throughput on Edges | Amount or rate of data flowing between two services. |
| Latency on Edges | Average latency between two connected services (if displayed). |
| Health Monitoring | Shows the current health status of components and their connections in the topology. |
Collected Metrics
Pod‑level Network Metrics
| Metric | Description |
|---|---|
| Rx packet count | Total number of packets received by the pod during the selected time range. |
| Tx packet count | Total number of packets sent by the pod during the selected time range. |
| Rx byte count | Total number of bytes received by the pod. |
| Tx byte count | Total number of bytes sent by the pod. |
| Network throughput | Rate of data transfer for the pod (bytes/second or similar). Helps identify pods sending/receiving high traffic. |
| SRTT latency | Smoothed Round Trip Time for TCP connections. Higher SRTT indicates slower network response. |
| Dropped packet count | Number of dropped packets, possibly categorized by reason (buffer issues, errors, congestion). |
| TCP retransmission count | Number of TCP packets retransmitted. High count indicates packet loss or unstable network paths. |
Service / Trace‑level Metrics
| Metric | Description |
|---|---|
| Network Latency | Average time taken for network calls between the service and its dependencies. |
| Network Throughput | Volume of data the service sends/receives over the network. |
| Network Retransmissions | How often packets are retransmitted. High values indicate instability or packet loss. |