Troubleshooting
1. Verify SNMP Trap Version and Credential Configuration
- Confirm whether the device is sending SNMP traps using version v1, v2, or v3.
- For SNMPv1 and v2: No encryption; the gateway can directly interpret Trap OIDs.
- For SNMPv3:
- If using, ensure the device matches the gateway’s predefined credentials. To obtain the list of predefined credentials, reach out to the OpsRamp Support Team.
- If using custom credentials, verify they are properly
Base64-encodedin the specified format and configured in the Gateway.
- See Custom SNMPv3 Credential Configuration for more details.
2. Verify trap in exclusion list
We need to check in two areas to confirm whether a trap is in the exclusion list or not.
- Client Level SNMP Trap Configuration
- Global Level Exclusion
How to check if the trap is excluded in Client Level SNMP Trap Configuration
Check if an SNMP Trap configuration exists at the client level by navigating to Setup → Monitoring → SNMP Traps Configuration. If a configuration is present, review the settings to determine whether the specific trap OID is excluded—either globally for all devices or for particular devices. Verify if the trap OID appears in the exclusion list.
How to check if the trap is in Global Exclusion List
Note
Refer to the “Exclude Trap” column in the Supported SNMP Traps sheet to see the list of global exclude traps.Example:
{
"oid": "1.3.6.1.4.1.232.165.0.3",
"trapName": "CPQPOWER-MIB::trapInformation",
"currentState": "Ok",
"excludeTrap": "Yes"
}
How do query the gateway database to get trap definitions?
To check the trap definition in the gateway database, please reach out to OpsRamp support.
3. Verify if traps are being received by the gateway by analysing the vprobe.log
Following are the steps to verify whether traps are being received to the gateway by analysing the vprobe.log
- Login to the gateway CLI with sudo su and enter gcli
- Add the following flag to enable logs
- flag add
snmptrap.logon 30 - click exit command to exit from the gcli
- Grep the vprobe logs with below string
grep 'Trap received: IP Address -' /var/log/app/vprobe.log
Example : Trap received: IP Address - {ipofdevice} TrapOid - {trapOid}
If you find the above string with trap OID, then SNMP trap was received to the gateway properly. Even if gateway received the trap and we didn’t see the trap in UI then, check if it is in dropping silently at gateway end (follow the above step to verify).
How to check whether a Trap was Converted to an SNMP trap alert
If a trap was received by the Gateway and you want to verify whether it was converted into an alert, check the vprobe logs using the following command:
grep 'Sending trap alert: IP Address - {ipofdevice}' /var/log/app/vprobe.log
Example: Sending trap alert: IP Address - {ipofdevice} TrapOid - {trapOid}
Note
If no trap entries are found in the logs, capture network packets to confirm whether the device is sending SNMP traps to the Gateway.Capture Packets to Verify SNMP Trap Delivery
If no SNMP traps appear in the Gateway logs, capture network packets to confirm whether the traps are reaching the Gateway.
Classic Gateway
Run the following command on the Classic Gateway CLI:
tcpdump -v "ip host {ipaddress} && udp port 162" -s 3000 -w /home/ruser/snmptrap.pcap
Note
Replace the IPaddress with the end device IP.This command captures SNMP trap traffic sent to UDP port 162 from the specified IP address and writes it to a .pcap file.
NextGen Gateway
- SSH into the Gateway node and switch to the root user
sudo su
- Check if the NextGen Gateway pod is running
kubectl get pod <podName> -n <namespace>
- If the pod is running, launch a debug container
kubectl debug -it nextgen-gw-0 \
--image=us-docker.pkg.dev/opsramp-registry/gateway-cluster-images/gateway-debugger:1.0.0 \
--share-processes -- /bin/bash
Once you see the prompt, copy the debug container name. Container name should be in the following format.
Example: debugger-4z5dt
- Execute the tcpdump command to capture the packets.
tcpdump -v "ip host {ipaddress} && udp port 11162" -s 3000 -w /home/snmptrap.pcap
Note
For host {ipaddress}, provide the IPaddress of end device.Press Ctrl+C to stop the capture once you’ve collected sufficient data.
To download the .pcap file from the gateway, copy the file from debug container to the gateway.
- Launch another gateway console and execute the following step:
Note
Previous debug container session in the other gateway console should be active. - Copy the file from the debug container to the gateway using the following commands:
kubectl cp <namespace>/nextgen-gw-0:/home/snmptrap.pcap -c <debugger container name> /home/snmptrap.pcapNote: Replace
If default,<namespace>with the appropriate value for your environment.kubectl cp nextgen-gw-0:/home/snmptrap.pcap -c <debugger container name> /home/snmptrap.pcap
- Launch another gateway console and execute the following step:
- Once the file is copied to the gateway, download the .pcap file and open it using Wireshark to verify that SNMP traps from the device are reaching the gateway.
Frequently Asked Questions
- Why there is mismatch in the SNMP traps?
If same trap is generated within 30 mins then that trap will be dropped at gateway end.
- Does OpsRamp generate repeat alerts if the same trap(with the Different state) is received within 30 minutes?
Yes
- Does OpsRamp generate direct Ok alerts without critical/warning ?
Yes, in case the handler is set to ‘I’ in the trap definition in the database.
- Why is OpsRamp treating these traps as direct OK alerts without any Critical/Warning state?
In specific cases, customers generate test traps to verify whether OpsRamp triggers alerts. For these traps, the system ignores the state value (OK, Debug, Informational, Critical, Warning, and so on.) and generates alerts solely to validate the trap integration. To support this test traps, the system uses the “handler” value “I” and generates direct OK alerts.
- In NextGen Gateway, which IP needs to be configured in end device to send SNMP traps?
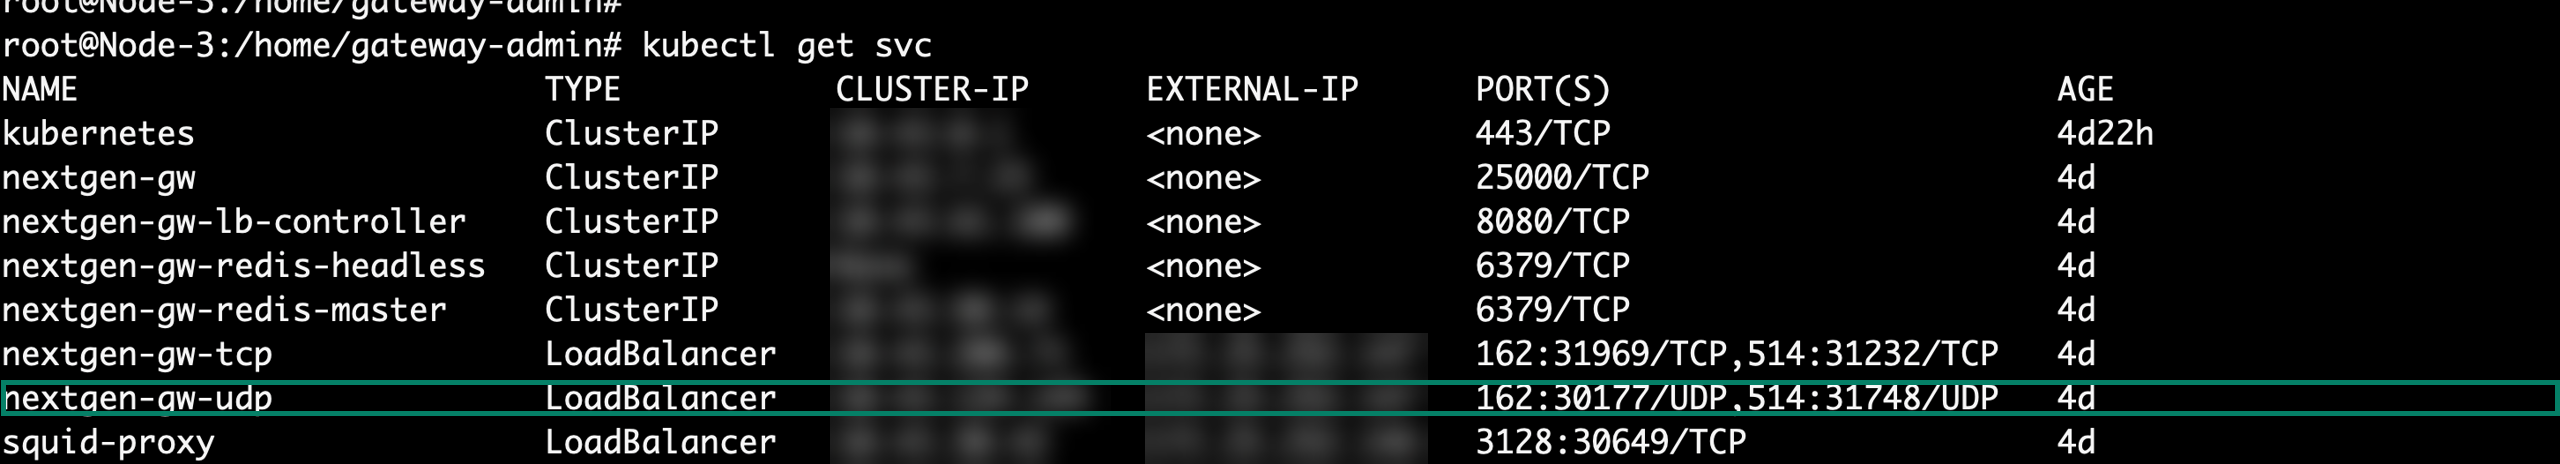
Configure the external IP of the UDP service on the end device to send traps to the Gateway.
- In the OpsRamp tool, what are the metric name and component name for an SNMP trap alert?
The metric name is SNMP TRAP, and the component name is the corresponding OID.The OID may be the SNMP trap OID or the recovery varbind oid based on the definition defined in the OpsRamp.
- In the OpsRamp tool, what are the subject and description for an SNMP trap alert if the trap definition is not available in OpsRamp?
If a trap definition is not available in OpsRamp, the SNMP trap alert will have the subject ‘<trapOID> is critical’ and the trap’s varbinding details will be included in the description.
- In the OpsRamp tool, what are the subject and description for an SNMP trap alert if the trap definition is available in OpsRamp?
If a trap definition is available in OpsRamp, the SNMP trap alert will use the subject defined in the trap definition, and the description will include the corresponding trap varbinding details.
- SNMPv3 traps may not be reaching the OpsRamp Gateway, or, if successfully received, they may not be triggering alerts as expected.
Potential caused include:
- Invalid SNMPv3 credentials configured on the device.
- Missing SNMPv3 credentials on the OpsRamp Gateway.
- Can I parse a substring from the varbind value and use it to define trap severity?
No
- As per the OpsRamp trap design, it is feasible to use varbinds to define severities. Based on these severities, OK/heal alerts will be mapped accordingly.
- In vendor MIBs, some vendors define specific varbinds that represent severity for each trap. These varbind are typically used for severity mapping and are referenced in trap configurations, in line with the OpsRamp design approach.
- How are trap severities mapped in OpsRamp?
Working Scenerio:
As per the trap design, we have an option to consider complete varbind value for defining any severity enumeration mappings Only varbinds that clearly represent severity or status are considered for mapping severity and healing alerts.
Excpected varbind values:
Example 1:
"panSystemDescription": "up",
"panSystemDescription": "down"
Example 2:
"panSystemDescription": 1,
"panSystemDescription": 2
Limitations and Non-working ScenerioIf a varbind contains a large descriptive value or exhibits dynamic behavior, there is no option to fetch the substring and map it for trap severity.
Example:
#1 [ panSystemDescription = BFD state changed to Up for BFD session 38 to neighbor {IPAddress} on interface
#2 [ panSystemDescription = BFD state changed to Down for BFD session 9 to neighbor {IPaddress} on interface (
| Actual Trap Severity | OpsRamp Severity |
|---|---|
| Fatal, critical, major, degrade, error, fault, notoperational, shutdown, and so on. | Critical |
| Minor, warning, degrade | Warning |
| Ok, info, debug | Ok |